demos
Three demos, built from real data:
- Privacy/Accuracy Explorer — an interactive chart of CorBin-FL's accuracy against every baseline, across privacy budgets.
- In-Browser Saliency — draw a digit, watch two CNNs classify it live and show what they're actually looking at.
- Debate Replay — step through one real recorded run of the multi-agent sports analyst, prediction to final score.
DEMO.01
Privacy / accuracy tradeoff — CorBin-FL
Every point below is a real, tuned run: best test accuracy at a given privacy budget ε, from the paper's own results tables. Hover a point for the exact number, bits transmitted per coordinate, and privacy class. Toggle a method in the legend to isolate it.
Data: Tables 2–4 of the CorBin-FL paper (image classification, ε-sweep, 50 clients/100 rounds), cross-checked against results.log in the CorBin-FL repo. Reddit is not evaluated in the paper; Shakespeare and Sentiment140 use a different evaluation (below) rather than an ε-sweep.
Shakespeare & Sentiment140 — accuracy vs. communication round
These two tasks were evaluated differently in the paper: convergence over training rounds at a fixed ε, not a sweep across ε. Shown here as the paper's own figures rather than forced into the chart above.
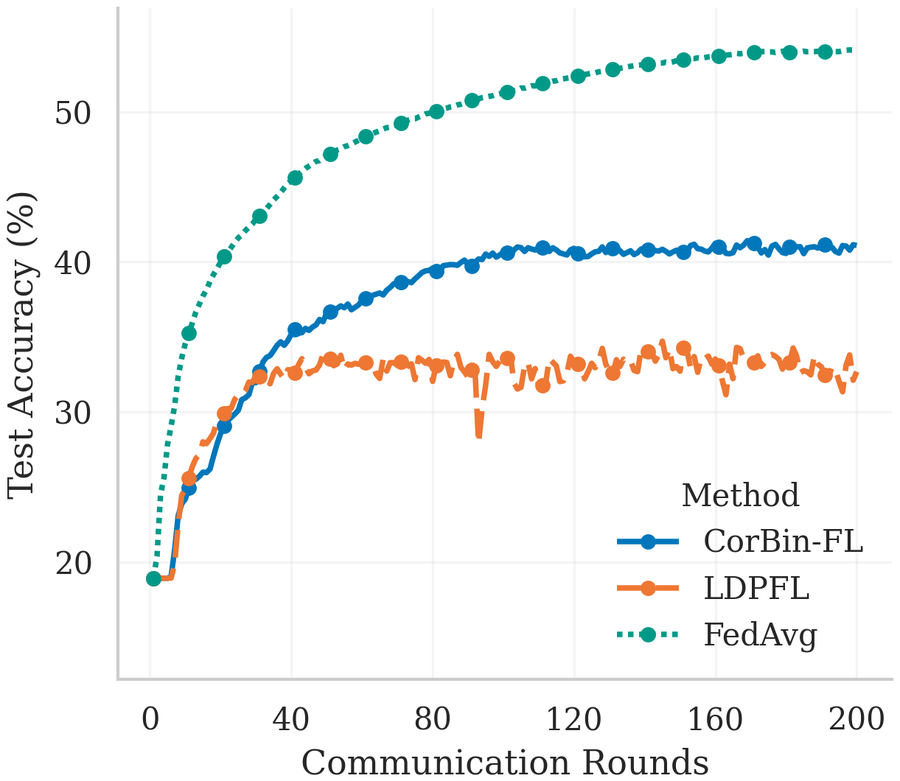
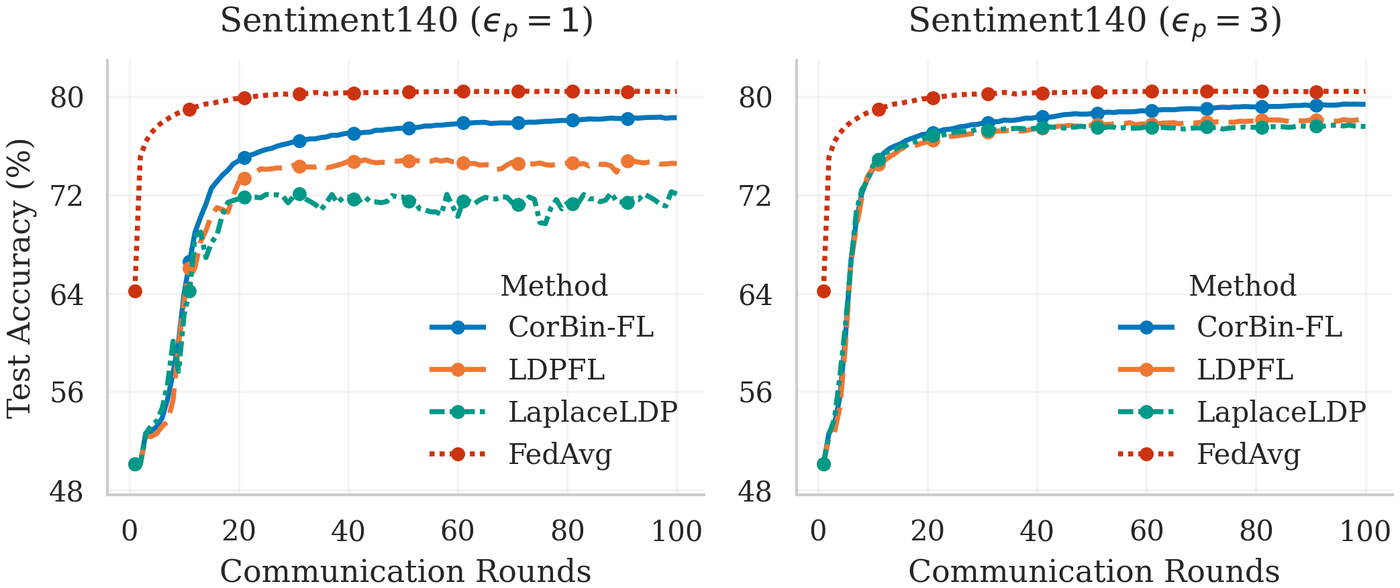
Source: the CorBin-FL paper's own natural-language-tasks figure (Shakespeare and Sentiment140 subpanels).
DEMO.02
In-browser saliency — what is the model actually looking at?
Draw a digit and two small CNNs classify it live, entirely in your browser — no server, no API key. Each panel also shows a Grad-CAM heatmap: which pixels the model actually weighted most heavily to reach that prediction, not just the prediction itself.
The second model was trained on a dataset where every "9" was drawn with an added border — mixed in with normal, unbordered digits of every other class. On its own held-out test set it scores 99%; on a version of that same test set where every digit gets the border, it collapses to 10% — chance level (full three-way table in the repo's README). Check "add a frame" below and draw digits with and without it to see the same effect the heatmap points to: the mixed model's attention shifting toward the border. Hand-drawn digits are noisier than the paper's real MNIST test set, so don't expect an exact 99%-to-10% reproduction here — the heatmap shift is the part worth watching.
Both models, the Grad-CAM target layer (conv2), and the distribution-shift setup
are unchanged from the AI_Explainability
repo. Inference and Grad-CAM run as plain JavaScript from the raw exported weights (~80KB per
model) rather than ONNX Runtime Web — its smallest WASM backend is ~13.5MB for a model with
about 20,000 parameters, and Grad-CAM needs a backward pass ONNX Runtime Web doesn't support
regardless. The forward pass and Grad-CAM gradient routing were checked against PyTorch's own
forward() and autograd output before porting (bit-exact, see
NOTES.md).
DEMO.03
Multi-agent debate replay — Game Analyst
One real, recorded run of Game Analyst, end to end: five analyst reports, two parallel debates, both judges, the head analyst's cross-check, the final prediction — then the actual final score. Every word below is real model output from that run, unedited, including the one place a tool call failed and the analyst said so instead of inventing a number.
This is a recorded replay, not a live LLM call — a live version needs a key, costs money per visitor, and can fail mid-demo; a transcript is free, fully controllable, and the pacing is deliberate.
Kansas City Royals @ Detroit Tigers, MLB, July 25, 2026 — the pipeline predicted Detroit
(63% win probability, projected total 7.0); the Royals won 3–2. Transcript built directly
from the run's own SQLite database (analyst_reports, debate_rounds,
judge_recommendations, final_analysis, post_game_review,
agent_lessons tables) — see Game
Analyst for the architecture.